The reports area has two different jobs. The main dashboard is for revenue and quantity analysis across customers, categories, and products. The SKU Opportunity report is for finding gaps: products a dealer should know about but has not purchased yet.
The reports dashboard is the analytical side of the CRM. Use it to compare customer buying patterns, category performance, and product sales instead of relying on memory or ad hoc exports.
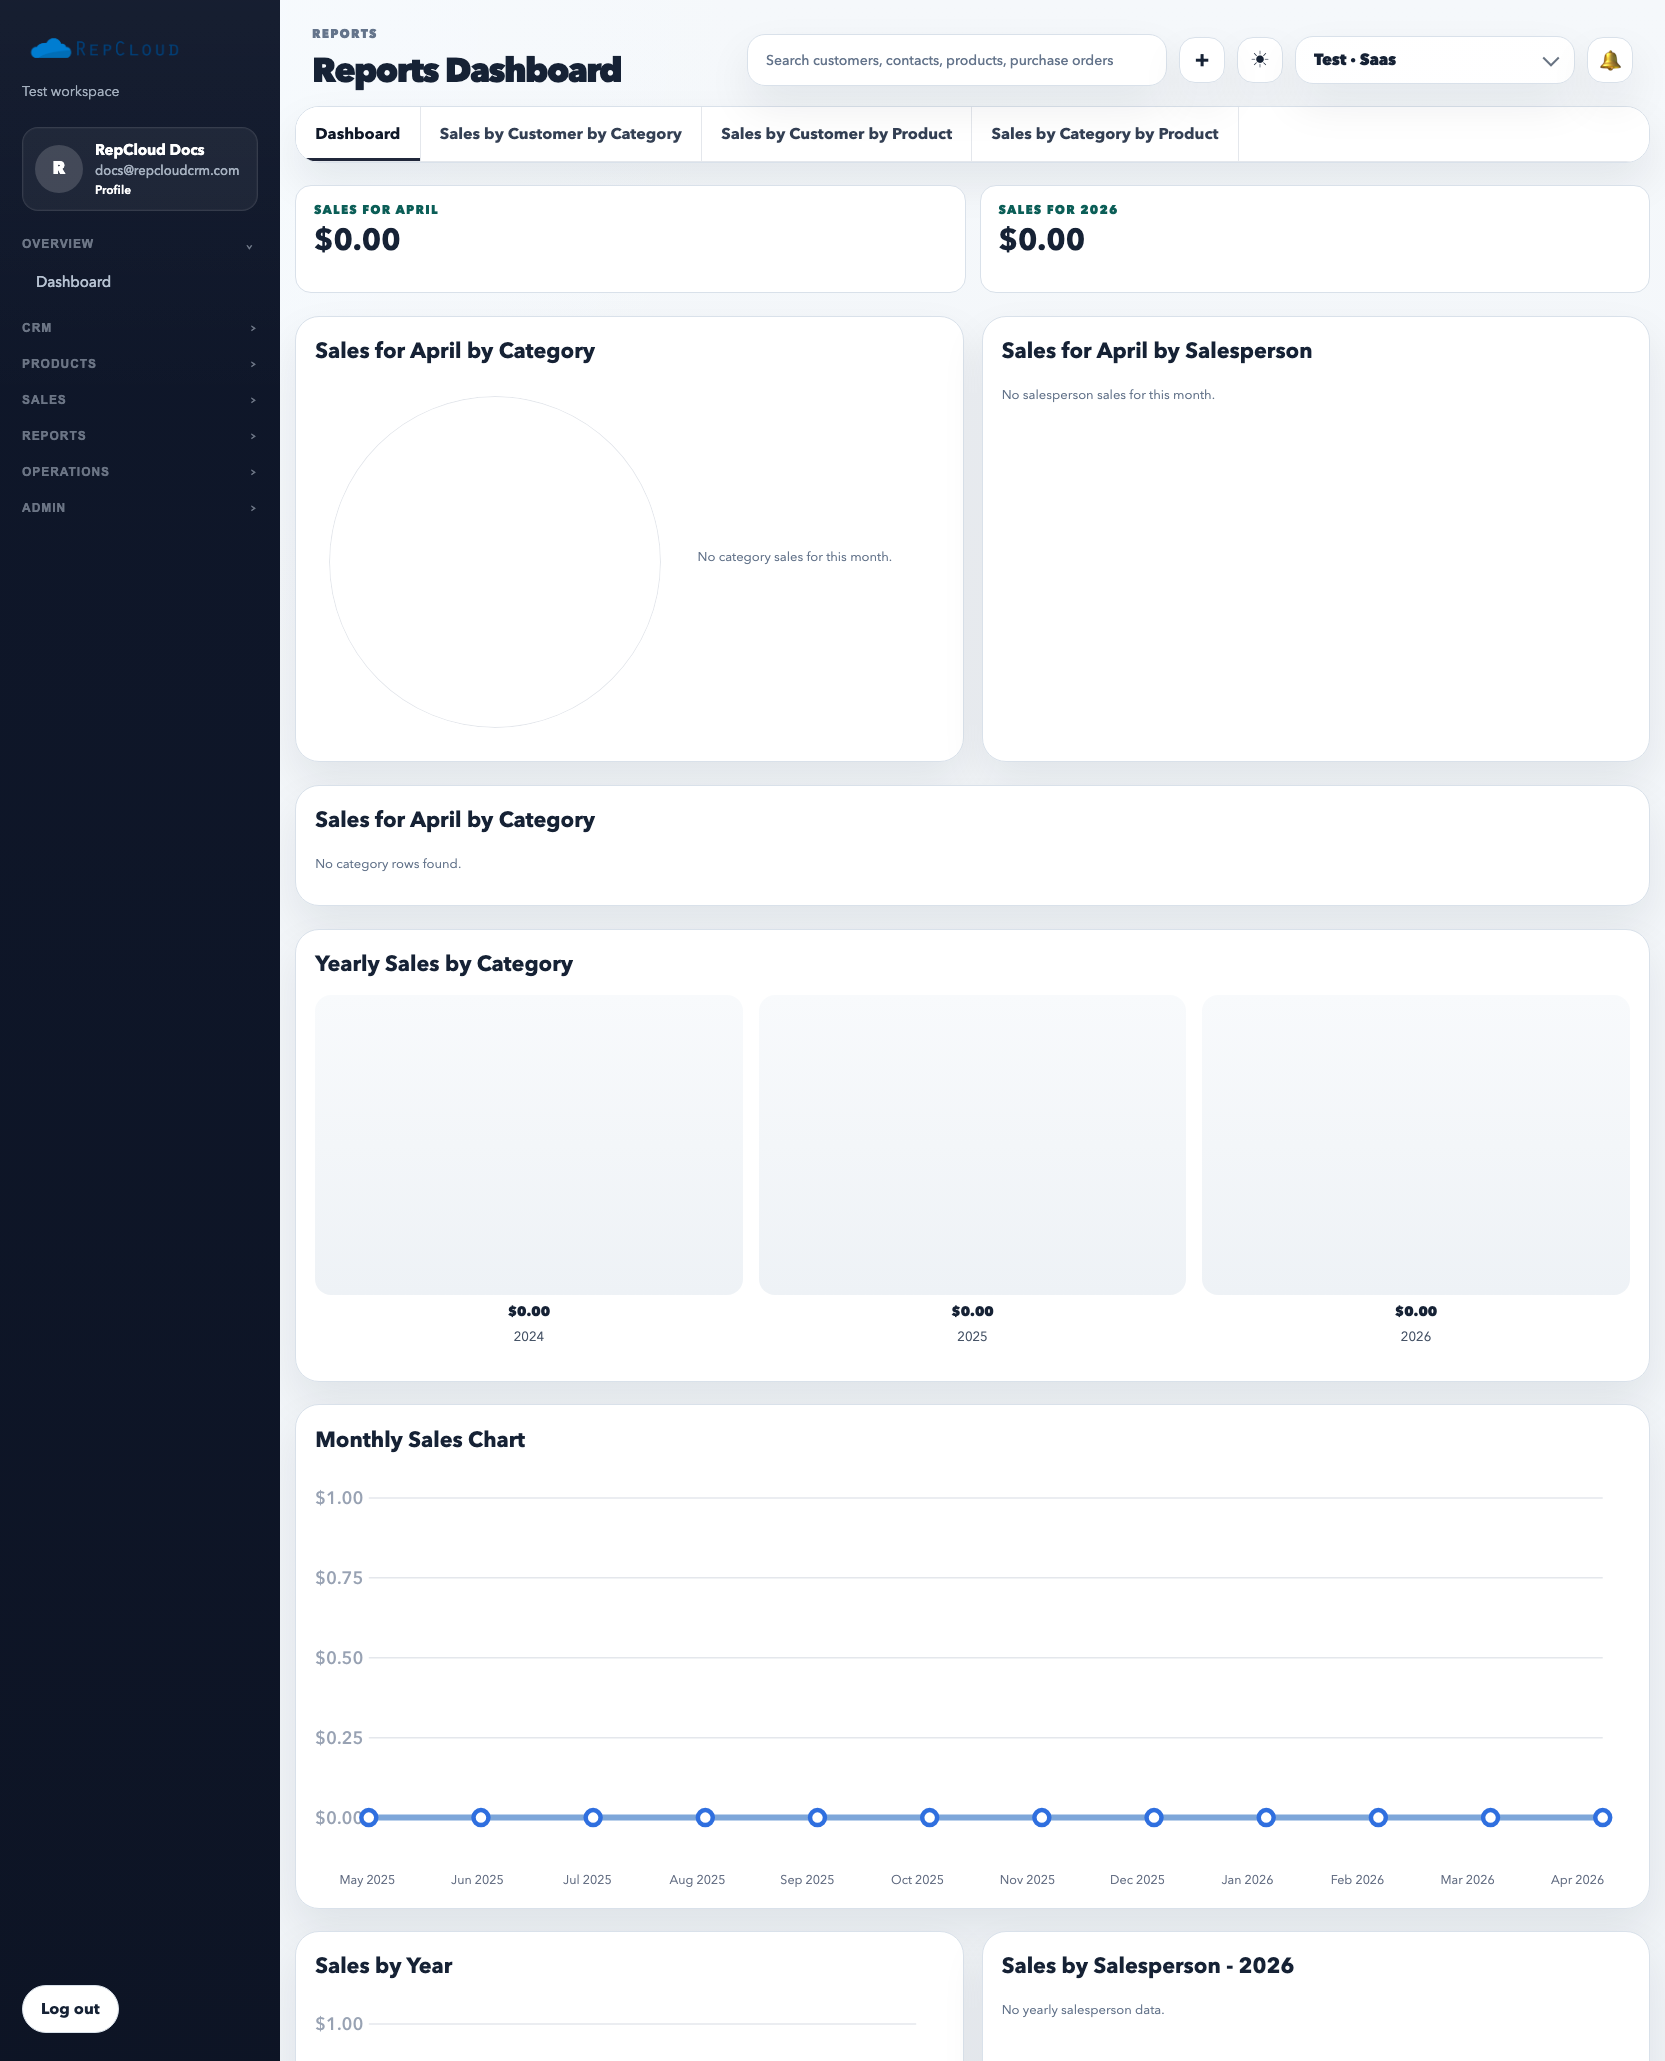
How to use the main reports dashboard
Open Reports.
Choose the report tab that matches the question you are asking: customer by category, customer by product, or category by product.
Run the report with the current filters before exporting anything.
Use sorting intentionally so the biggest revenue or quantity rows rise to the top.
Export only after the on-screen result is correct.
What each report type is good for
Customer by category: which customers buy the most from each category.
Customer by product: what each customer is actually buying at the SKU level.
Category by product: which SKUs drive sales inside a product family.
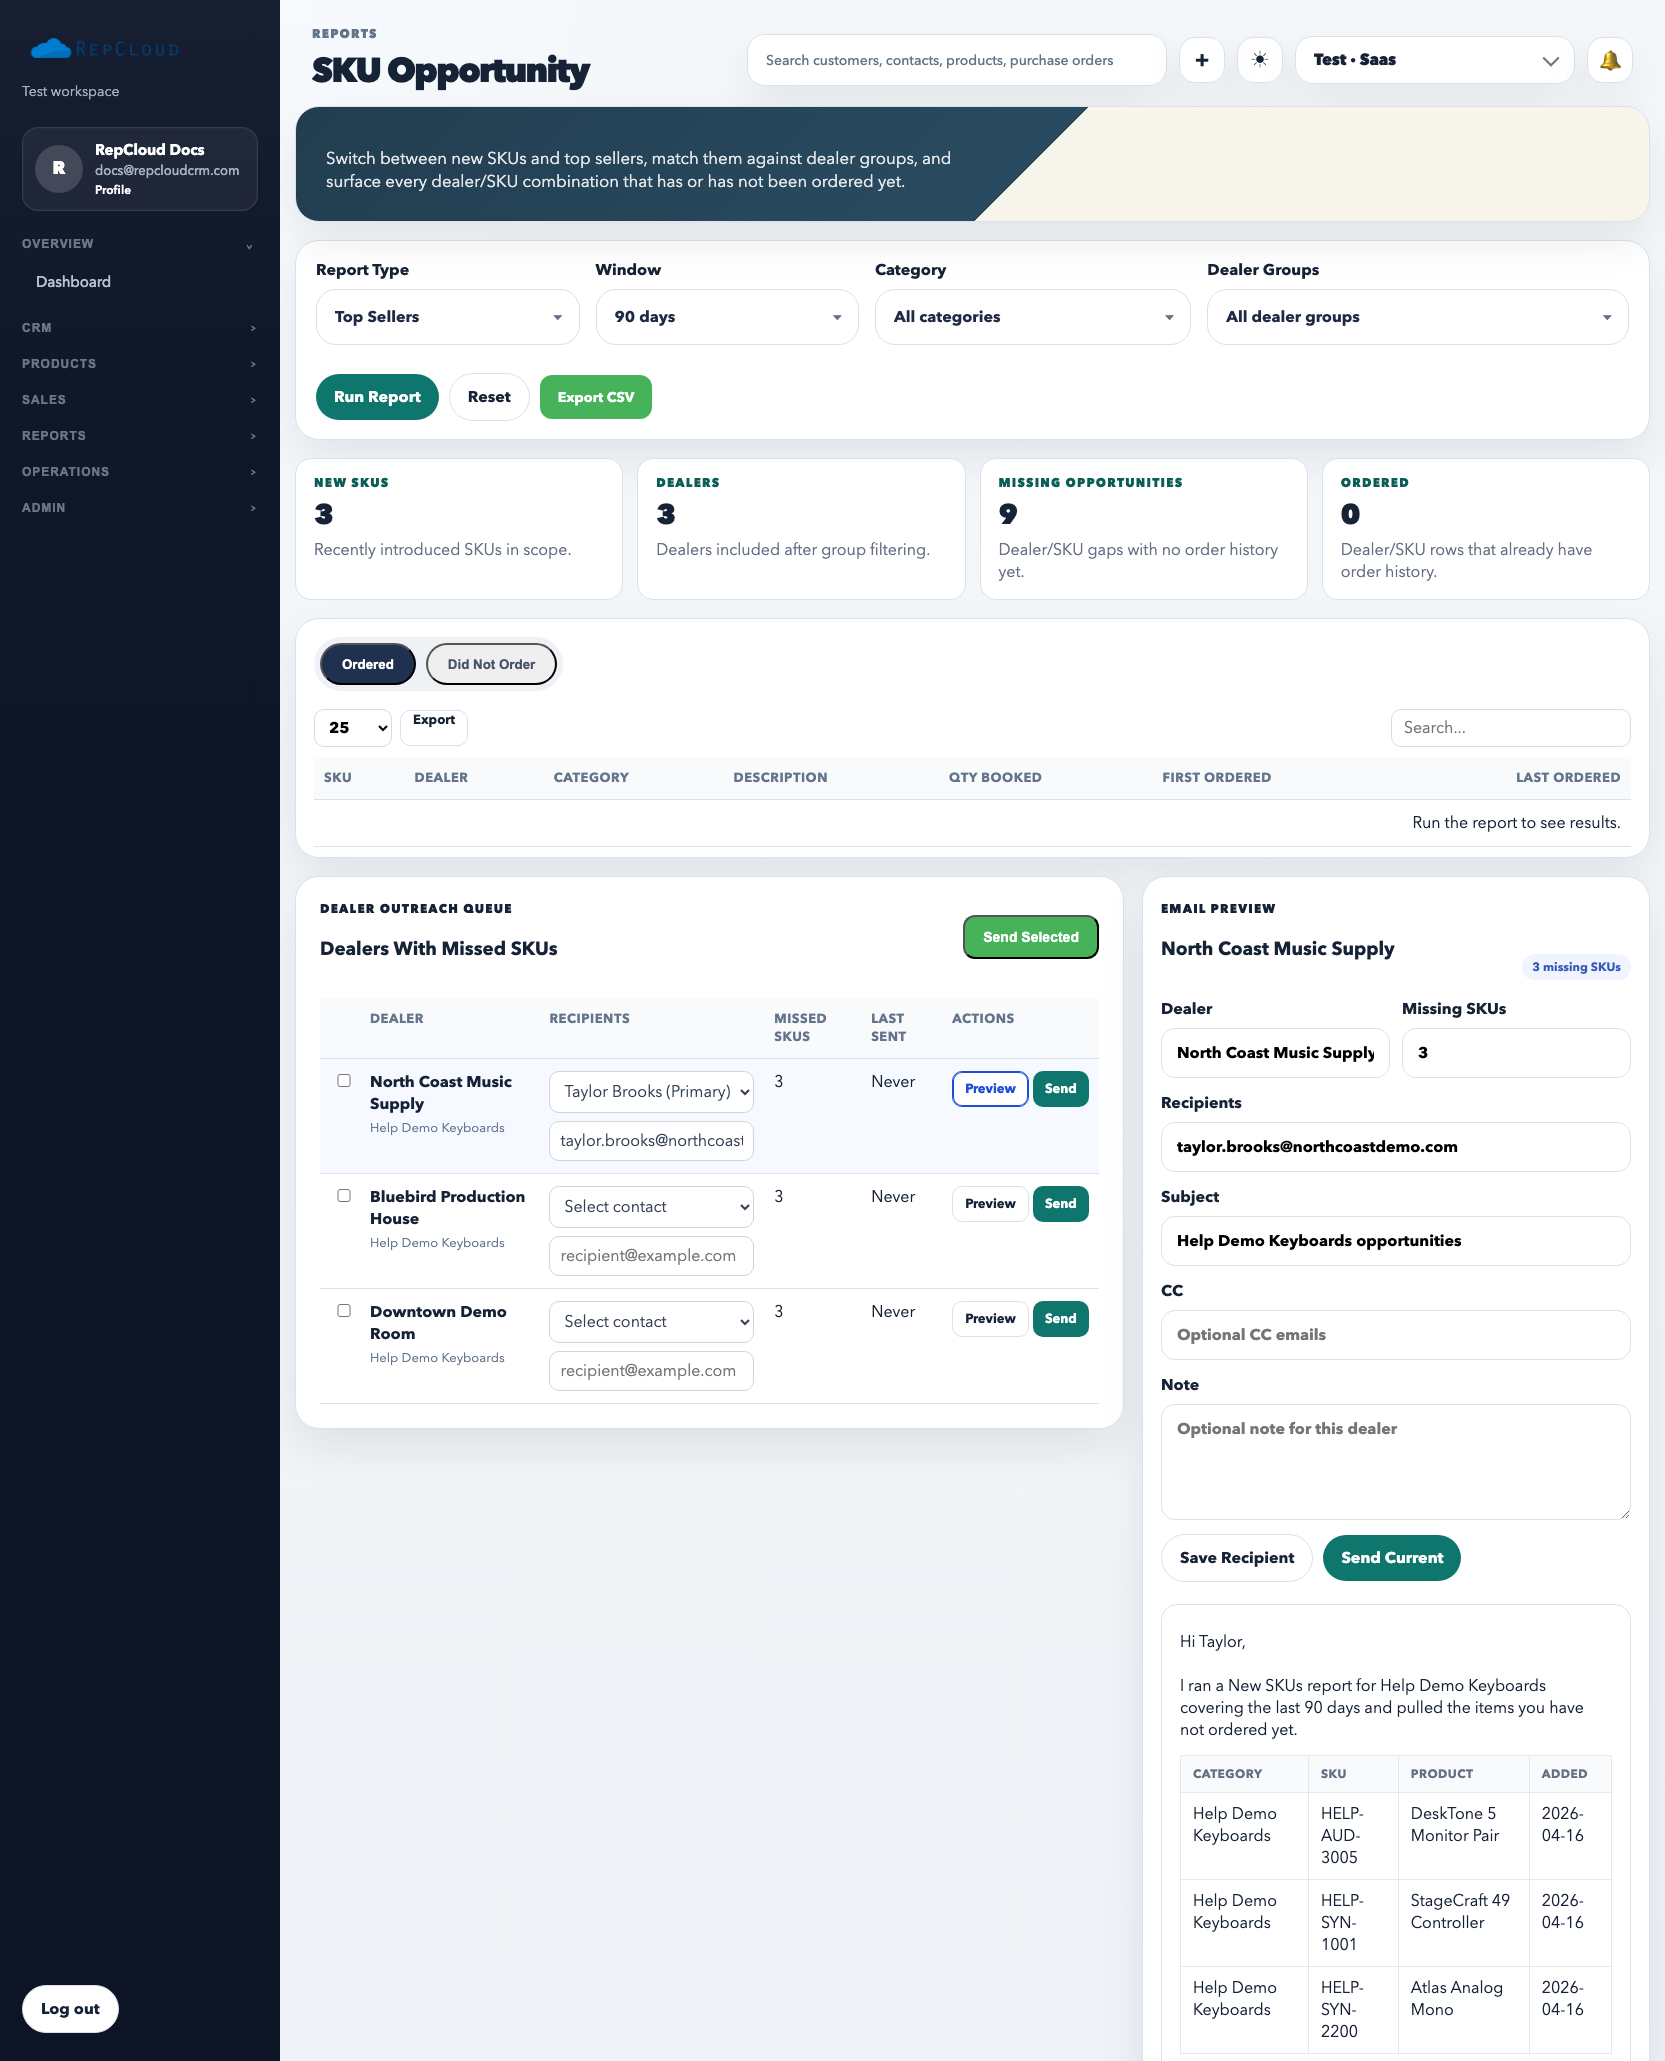
SKU Opportunity is for selling action, not just analysis. It shows what a customer has purchased and what similar or newly available SKUs they still have not bought.
How to use SKU Opportunity
Open Reports → SKU Opportunity.
Run the report for the current date range and result view.
Review the missing rows to see what the customer has not purchased yet.
Use the outreach queue when you want to turn the report into a sales action.
Best practices
Use reports to answer one concrete business question at a time.
Filter first, then export. Do not export giant raw data sets just to sort them later.
Turn insight into action. A report is only useful if it changes a sales, pricing, or support decision.
Common mistakes
Using the wrong report tab for the question.
Skipping the run step and assuming old data on screen is current.
Exporting before verifying filters and sort order.
Looking at SKU opportunity data without following up on the actual missing products.